39 Instagram Statistics Every Marketer Should Know in 2024
Ever since it debuted in 2010, Instagram statistics shows that it has reached more than 2 Billion active users, making it one of the best and most popular social media platforms worldwide. Well If we put this on scale you will be surprised to know that around one-third of the world population use this app each month.
If you are someone who is looking for a marketing strategy for Instagram in 2024, it’s very important for you to stay up to date with the latest Instagram trends and stats.
Brief about Instagram ———-
| Launched on | October, 2010 |
| Headquarters | Menlo Park, California, United States |
| Founded by | Kevin Systrom and Mike Krieger |
Instagram Statistics 2024
- Instagram MAU’s (Monthly Active Users) are over 2.4 billion all across the globe.
- It is ranked as 3rd most used Social Media Platform in the world along with Facebook and Whatsapp.
- Over 500 million people access Instagram daily which is way more than the population of many other countries like Germany, France, United Kingdom, Italy, etc.
- With this, Instagram becomes the most usable application in India with over 300 million users, followed by the United States (150 million) and Turkey (55 million).
- On average people around the world spend 24 minutes a day on Instagram.
Suggested Reading –
Instagram Monthly Active Users (MAUs)
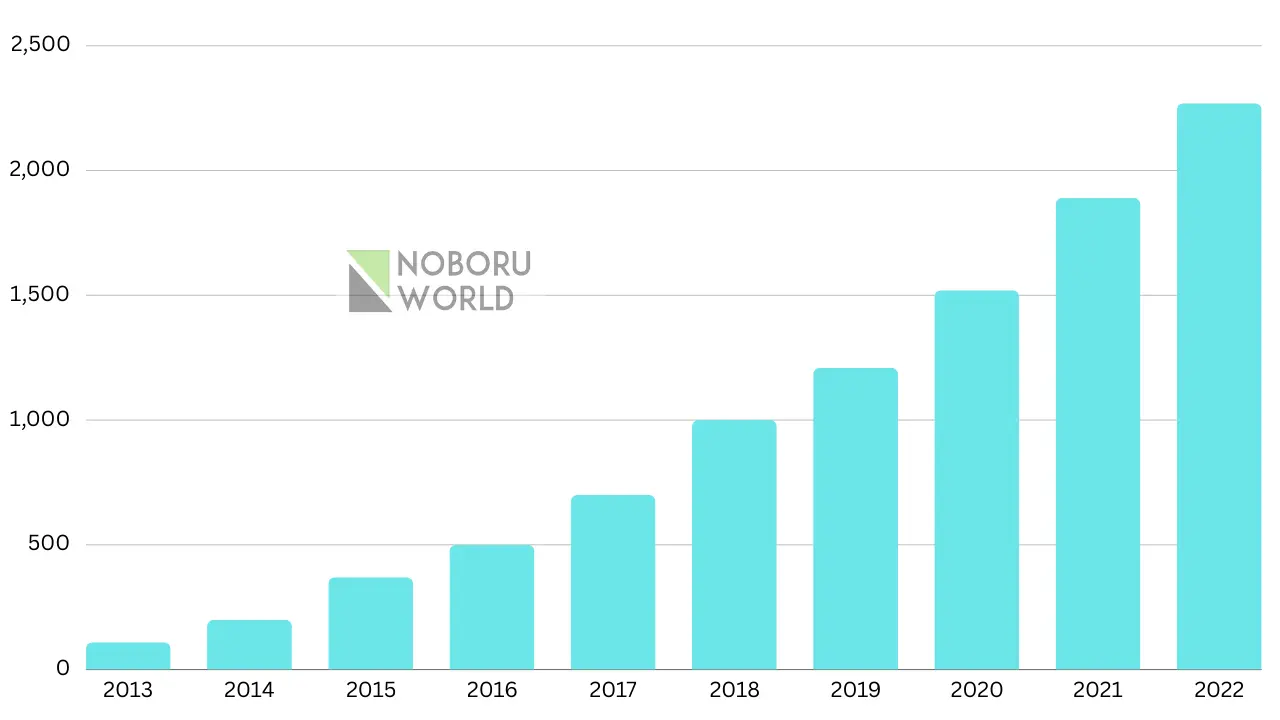
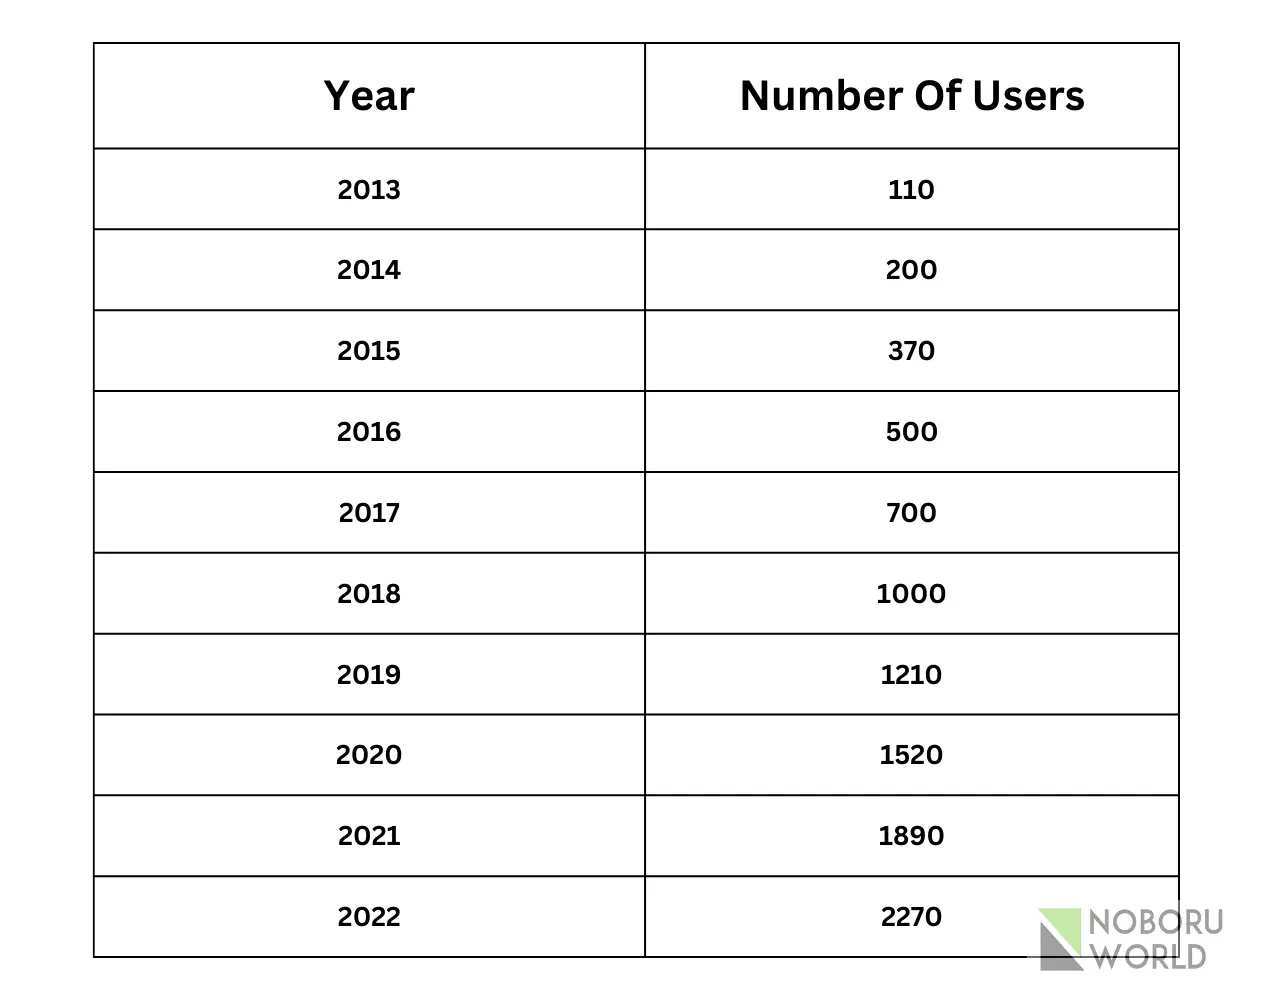
As of now the platform has over 2.4 billion monthly active users, and recently instagram has acquired around 100 million new users.
Key Statistics:
- Instagram’s user base continues to surge, boasting over 2.4 billion monthly active users globally.
- India remains the undisputed leader in terms of Instagram’s reach, with a colossal 229.55 million strong ad audience.
- Instagram’s penetration among internet users is remarkable, with around 40% of the world’s 5.3 billion active internet users accessing the platform regularly.
- The platform’s dominance within the social media landscape is undeniable, with over 40% of the world’s 4.95 billion active social media users being regular Instagram users.
- Instagram’s reach extends far beyond individual countries, exceeding the combined populations of Europe and North America.
Instagram’s Monthly Active Users (MAUs) Throughout the Years:
Early Days (2010-2012):
2010: Founded by Kevin Systrom and Mike Krieger, Instagram launches with just a handful of features, focusing on mobile photo sharing.
2011: Reaches 1 million users within six months, showcasing its early appeal.
2012: Acquired by Facebook for $1 billion, marking a turning point in its growth trajectory.
Breakthrough and Rapid Expansion (2013-2018):
2013: Hits 100 million MAUs, solidifying its position as a major social media player.
2016: Surpasses 500 million MAUs, driven by the introduction of new features like Stories and Direct Messages.
2018: Reaches the 1 billion MAU milestone, cementing its status as a global phenomenon.
Consolidation and Continued Growth (2019-Present):
2019: Focuses on refining existing features and building a more engaged user base.
2020: Sees a surge in usage due to the COVID-19 pandemic, reaching 2 billion MAUs by October 2022.
2023: Boasts over 2.4 billion MAUs, continuously expanding its reach and influence.
Instagram Users By Country
With 229.55 million users, India remains the undisputed leader in Instagram audience size, followed by the United States (143.35 million) and Brazil (113.5 million). Indonesia holds steady in fourth place with over 105 million users.
| Rank | Country | Monthly Active Users (Millions) | % of Global MAUs |
| 1 | India | 229.55 | 9.56% |
| 2 | United States | 143.35 | 5.97% |
| 3 | Brazil | 113.50 | 4.73% |
| 4 | Indonesia | 105.00 | 4.38% |
| 5 | Turkey | 56.70 | 2.36% |
| 6 | Japan | 51.00 | 2.12% |
| 7 | Mexico | 36.70 | 1.53% |
| 8 | Philippines | 35.00 | 1.46% |
| 9 | Germany | 34.50 | 1.44% |
| 10 | Vietnam | 34.00 | 1.42% |
Latest Instagram Stories Statistics:
Instagram Stories have become an irreplaceable part of the platform, offering brands and individuals a dynamic and engaging way to connect with their audience. But what’s the current state of this ever-evolving feature? Let’s dive into some updated Instagram Stories statistics for 2024:
Reaching a Massive Audience:
- 2 billion+ MAUs: Over 2 billion Instagram users actively access Stories every month, representing a significant portion of the platform’s total user base.
- High Engagement: On average, 500 million accounts use Stories daily, showcasing their popularity and potential for reach.
- Top Engagement Format: Stories boast a higher engagement rate compared to other content formats on Instagram, with brands seeing an average of 1.88% engagement through carousels.
Content Consumption Trends:
- Short and Sweet Wins: Videos hold the edge in Stories, with 62% of users preferring video content over static images.
- Interactive Elements Matter: Polls, quizzes, and questions stickers generate 81% higher completion rates compared to regular Stories.
- Stories Highlights Drive Traffic: Highlights, collections of permanent Stories, see 12 times more views than regular Stories.
Brands and Businesses Thrive on Stories:
- Increased reach and awareness: 62% of users claim to discover new brands or products through Stories.
- Improved brand perception: 45% of users say Stories make them feel more connected to brands.
- Effective sales conversions: Swipe-up links in Stories have a 24% click-through rate, driving direct sales and website traffic.
Global Story Powerhouses:
- India leads the pack: With over 229.55 million users, India boasts the largest Instagram Stories audience globally.
- The United States and Brazil follow: The US comes in second with 143.35 million, while Brazil ranks third with 113.5 million.
Looking Ahead:
- E-commerce integration: Expect more seamless shopping experiences within Stories, blurring the line between content consumption and purchase.
- AR and VR advancements: Augmented reality and virtual reality elements have the potential to further enhance the interactive nature of Stories.
- Community building focus: Live collaborations and interactive features will likely play a bigger role in fostering audience engagement and building stronger communities.
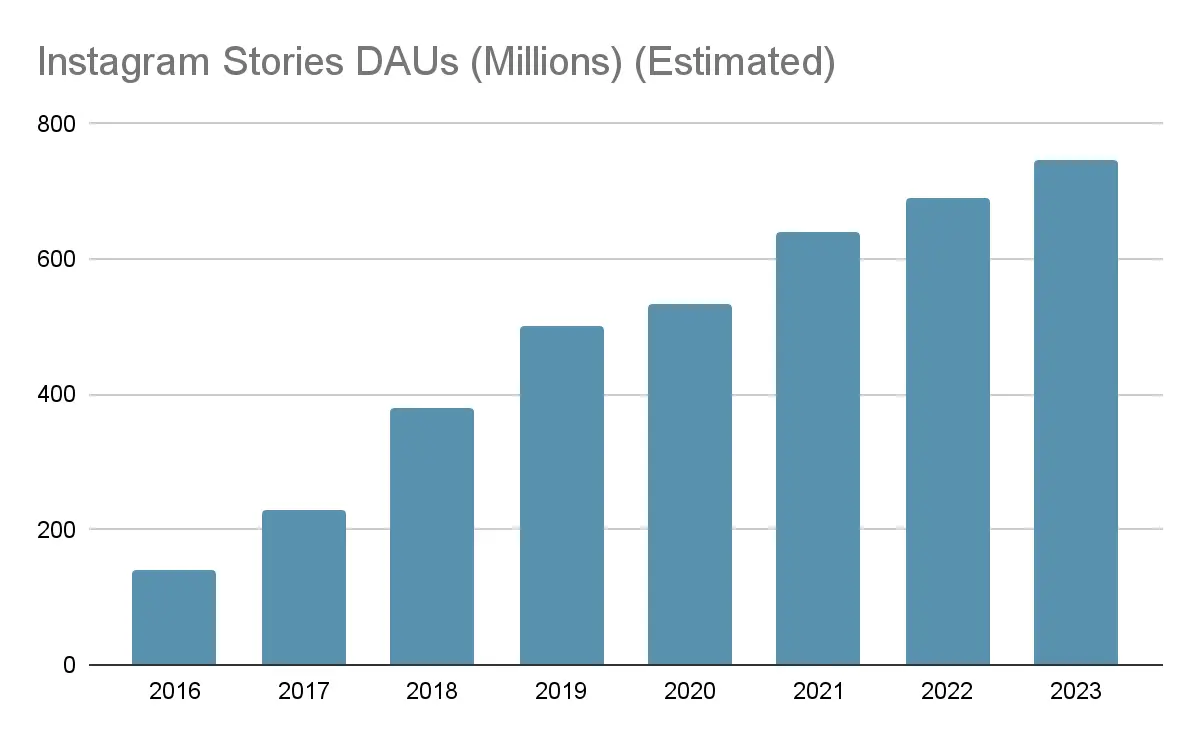
| Year | Estimated Instagram Stories DAUs (Millions) |
| 2016 | 100-150 |
| 2017 | 200-250 |
| 2018 | 350-400 |
| 2019 | 500 |
| 2020 | 500-550 |
| 2021 | 600-650 |
| 2022 | 650-700 |
| 2023 | 700-750 |
Most used Platforms Worldwide
| Category | Platform | Monthly Active Users (MAUs) | Key Features |
| Social Media | 3.03 billion | Newsfeed, sharing updates, messaging, groups, events | |
| Youtube | 2.49 billion | Video sharing, live streaming, subscriptions, comments | |
| 2 billion | Messaging, voice and video calls, group chats, status updates | ||
| 2 billion | Photo and video sharing, Stories, Reels, Direct Messages | ||
| 1.32 billion | Multi-purpose platform with messaging, payments, social media, and mini-programs | ||
| TikTok | 1.05 billion | Short-form video sharing, live streaming, challenges, filters | |
| Telegram | 800 million | Secure messaging, group chats, large file sharing, bots | |
| Snapchat | 750 million | Photo and video sharing with disappearing content, filters, augmented reality | |
| Douyin | 743 million | Short-form video sharing, similar to TikTok but primarily in China | |
| Kuaishou | 673 million | Short-form video sharing, live streaming, e-commerce integration | |
| Search Engine | 5.3 billion | Web search, image search, news, maps, translate | |
| Communication | Facebook Messenger | 1.03 billion | Messaging, voice and video calls, group chats, integrations with other Facebook apps |
| Zoom | 300 million | Video conferencing, online meetings, webinars, chat | |
| E-commerce | Amazon | 400 million | Online marketplace for various products, Prime membership, reviews, delivery |
| Alibaba | 800 million | Chinese e-commerce giant, Taobao, Tmall, Alipay, logistics | |
| Video Streaming | Netflix | 223 million | On-demand streaming platform for movies, TV shows, documentaries, originals |
| Disney+ | 152 million | Streaming platform for Disney, Pixar, Marvel, Star Wars, National Geographic content |
Instagram User Demographics by Gender
Global Gender Distribution:
Almost evenly split: Globally, Instagram’s user base is nearly evenly split between genders, with 49.7% female users and 50.3% male users. This represents a slight shift towards a more even distribution compared to past years.
Regional Variations:
Female dominance in some regions: While the global picture is close to equal, certain regions have a higher concentration of female users. For instance, in the United States, 56% of Instagram users are female, whereas in India, it’s almost the other way around, with 43.5% female users.
Age Groups and Gender:
Younger generations show more balance: Interestingly, younger generations on Instagram exhibit a more balanced gender distribution. Among users aged
- 18-24, the split is 51.8% male and 48.2% female.
- 25-34, the split is 51.5% male and 48.5% female.
- 35-44, the split is 52.2% male and 47.8% female.
- 45-54, the split is 53.1% male and 46.9% female.
This trend shifts slightly towards males with increasing age groups.
Instagram User Income Demographics
- Middle-income users take the lead: While data varies slightly across sources, recent estimates suggest that around 40-45% of Instagram users globally fall within the mid-income range ($30,000 – $74,999 annual income).
- Low-income and high-income segments follow: Roughly 35-40% of users belong to the low-income category (<$29,999 annually), while those with high incomes (> $75,000) comprise approximately 15-20% of the user base.
Average Number of Instagram Followers
| Follower Range | % of Users |
| Less than 1,000 | 24.72% |
| 1,000 – 10,000 | 47.89% |
| 10,000 – 50,000 | 15.67% |
| 50,000 – 100,000 | 3.30% |
| 100,000 – 500,000 | 3.81% |
| 500,000 – 1 million | 0.68% |
| Over 1 million | 0.93% |
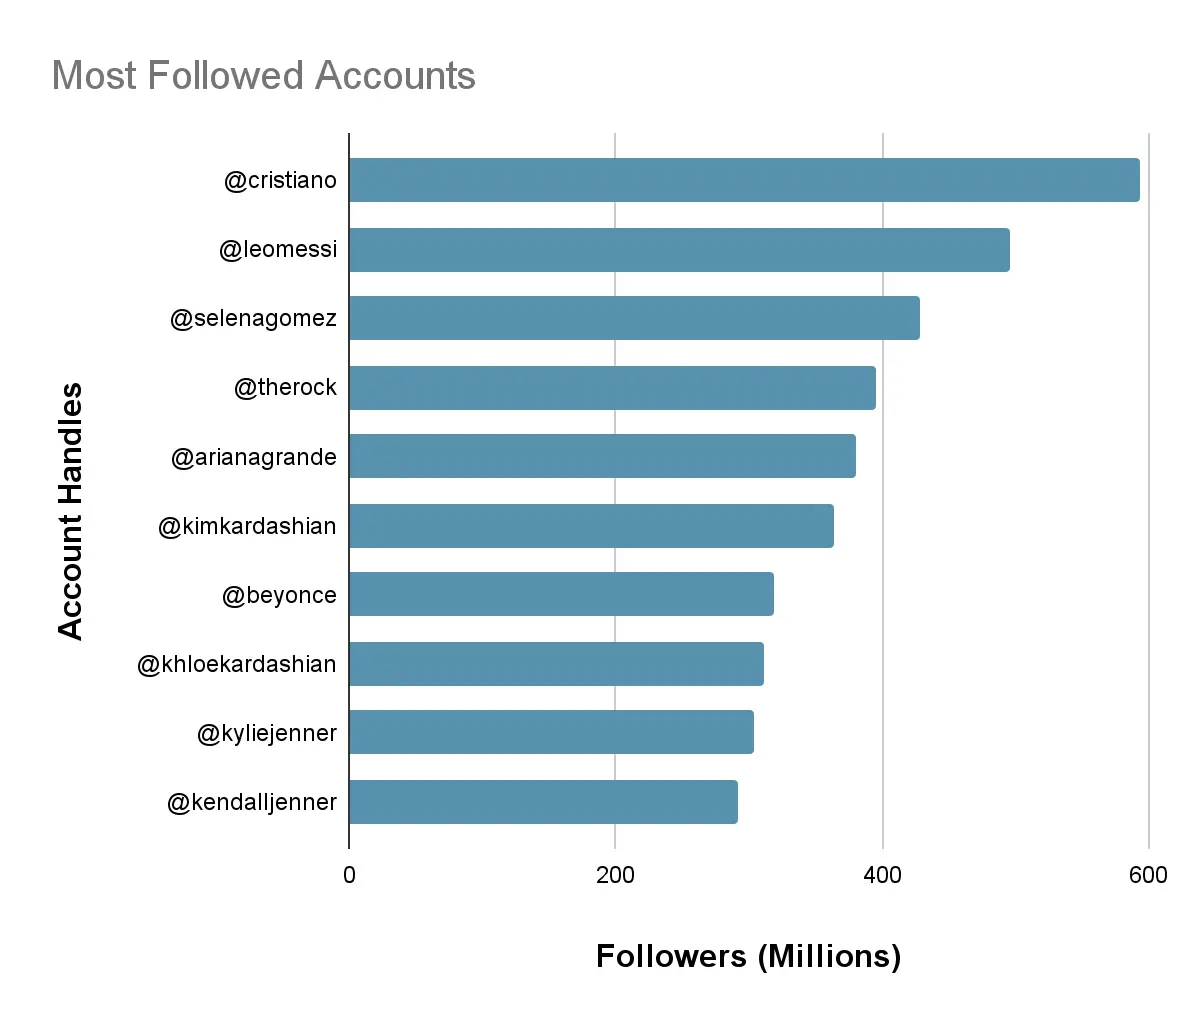
Most Followed Instagram Accounts
Below is the list of most followed accounts on Instagram platform in 2024 –
Threads By Instagram: Statistics & More
If you still don’t know, Threads, launched in July 2023 as a separate app for close friends connections. It has experienced a whirlwind journey.
In starting it has experienced impressive growth but with time its user base has stabilized.
Let’s explore the statistics surrounding Threads by Instagram:
Early Surge Followed by Stability:
Explosive Launch: Upon release, Threads crossed 1 million users within an hour and reached 100 million within five days. With its fueled novelty and hype threads has surrounded a dedicated close friends space.
Settling Down: But this initial surge did not sustain any longer. Daily active users (DAUs) peaked at 49.3 million on July 7th, but have fallen significantly within a week, reaching 23.6 million by July 14th. As of December 2023, Threads has around 10.3 million DAUs.
Reasons for the Decline:
Feature Overlap: Some users found Thread’s features already available in Instagram’s Direct Messages.
Privacy Concerns: Initial privacy issues within Threads raised concerns among some users.
Limited Functionality: Compared to Instagram, Threads offered very less features and content options, potentially limiting its appeal for some users.
Threads Users Count
Total Users: Estimated to be around 141 million globally.
Daily Active Users (DAUs): Approximately 10.3 million.
Most Followed Account: As of December 2023, Neymar (@neymarjr) boasts the most followers on Threads with over 10.6 million.
Instagram Daily Active Users: What do you think?
Since Q3 2022, when instagram has boasted over 500 million DAUs, it hasn’t revealed its daily active user numbers.
This strategic silence sparks curiosity among users, leaving analysts to piece together the puzzle based on available data and trends.
Estimated Numbers:
500 million +: Now according to industry reports and extrapolation from monthly active user (MAU) data, estimates suggest that Instagram’s DAUs currently range between 500 million and 1 billion globally.
Regional Variations: User engagement varies significantly across regions. For example, India with its massive user base likely contributes a substantial portion of DAUs compared to smaller markets.
Best time to post on Instagram
Lets see the global picture first:
- Weekday Wins: Generally, weekdays (Monday-Friday) tend to be more optimal than weekends for posting, as users are often more active during their workweek routines.
- Mid-Morning Magic: Aim for the mid-morning sweet spot – between 9 and 11 AM – to catch users checking their phones before or during work.
- Lunchtime Lull: Avoid the midday slump (roughly 1-3 PM) when engagement tends to dip as users get busy with their lunch breaks or meetings.
- Afternoon Advantage: The late afternoon resurgence (4-6 PM) can be another good time to post, catering to users winding down their workdays or commuting home.
Beyond the Clock:
- Content is King (or Queen!): Ultimately, the best time to post is when your content resonates most with your audience. High-quality, engaging content can win over audiences regardless of the exact posting time.
- Experiment and Analyze: Don’t be afraid to experiment with different times and analyze your post performance using Instagram Insights. Track likes, comments, and reach to identify your most effective posting window.
- Consistency is Key: Maintaining a consistent posting schedule regardless of time helps build user expectations and keeps your audience engaged.
Time Zone Twists:
If you have a global audience, adjust your posting times to align with specific regions. Tools like Hootsuite or Buffer can help schedule posts for optimal local reach.
Time to Post Daily:
Below is the detailed chart for best times to post on Instagram globally:
| Day | Best Time (Eastern Time) | Alternative Time |
| Monday | 9:00 AM – 11:00 AM | 4:00 PM – 6:00 PM |
| Tuesday | 9:00 AM – 11:00 AM | 4:00 PM – 6:00 PM |
| Wednesday | 9:00 AM – 11:00 AM | 4:00 PM – 6:00 PM |
| Thursday | 9:00 AM – 11:00 AM | 4:00 PM – 6:00 PM |
| Friday | 9:00 AM – 11:00 AM | 4:00 PM – 6:00 PM |
| Saturday | 10:00 AM – 12:00 PM | 6:00 PM – 8:00 PM |
| Sunday | 10:00 AM – 12:00 PM | 6:00 PM – 8:00 PM |
But remember, timings mentioned above could vary since this field is quite uncertain and hard to determine.
Conclusion
That’s a wrap on the amazing world of Instagram users! Whew, gathering all these insights wasn’t easy, considering Facebook’s tight grip on data for their platforms. But, I hope this compilation has been valuable!
We’ve explored the depths of Instagram user demographics, but the journey doesn’t end here! Do you have any burning questions about specific aspects of the platform or its users?
Perhaps you’re curious about Gen Z engagement on Reels, or maybe you want to know the top brand demographics on Instagram. Whatever it is, don’t hesitate to leave a comment below. We can keep diving deeper together!
And if you are someone who is looking for an agency to grow your instagram followers or website traffic organically, contact us now!
- 36 Facebook Statistics and Facts for Every Marketer in 2024
- Ultimate Facebook Marketing (meta ads) 2024



We would love to have your opinion.